One of the biggest challenges of modern business leadership is building a culture that engages every employee in improvement and innovation. Top-down leadership models don’t work well in today’s distributed, agile, and hyper-competitive business environment. Rather than micro-managing every decision, successful leaders govern with the transparency necessary to empower employees to make decisions and introduce positive change that moves them closer to their most critical strategic goals and objectives.
KaiNexus helps customers reach this state by introducing an unprecedented level of strategic and tactical visibility at all levels of the organization.
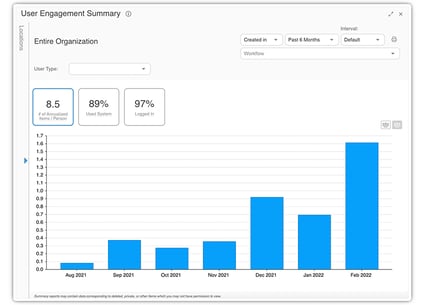
One of the primary responsibilities of leaders is removing roadblocks and clearing the way for each contributor to make forward progress. This is difficult, if not impossible, without visibility into the daily activities of each department or team. Visualizing quality improvement initiatives is the best way to help leaders react and respond proactively to stalled progress exactly when help is needed.
For many employees, the concepts of performance management and continuous improvement are vague and difficult to materialize. However, when you provide visible data in the form of charts and graphs that display progress (or lack thereof) toward critical goals, suddenly, people feel more in control of the elements that make up business success. In addition, when people see the impact their efforts have on key performance indicators, they become more invested in those results.
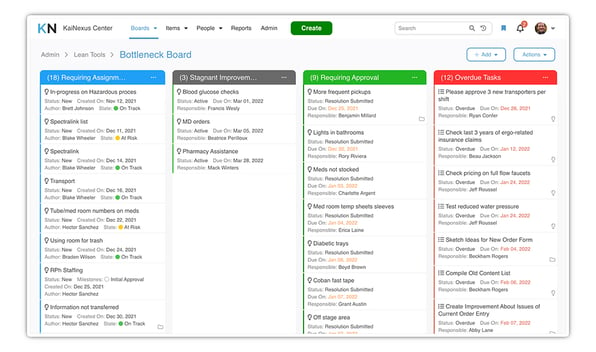
Visual management of quality improvement work changes the focus of meetings from updates and recaps to an opportunity for strategic planning and problem-solving. The areas that need attention are on full display for everyone involved so that you can get right to the most important topics. As a result, people can engage equally regardless of where they happen to be, and data drives the agenda.
When the same visual information platform is used across the organization, a common way of addressing problems, accessing processes, and documenting results develops. This shared experience for all units makes it easier to collaborate across department or team boundaries. The most significant opportunities for improvement can be found when work moves from one functional area to another, so improvements in collaboration are game-changing.
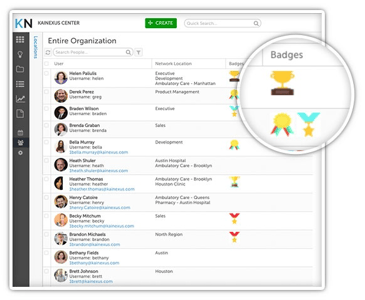
The most effective way to expand improvement culture and engagement within an organization is to celebrate wins, both big and small. Visual management makes it possible to calculate and share the impact of improvement, inspiring team members to add to the momentum.
If your organization is ready to accelerate improvement, spread a quality culture, and engage every employee in meeting your most important objectives, KaiNexus has the capabilities you need.
With the KaiNexus platform, you get:
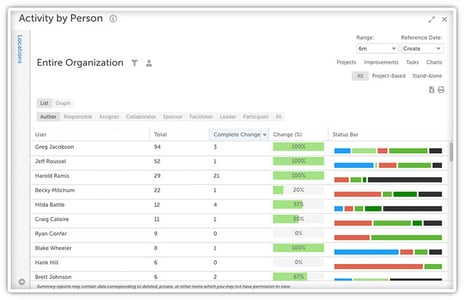
Leaders dedicated to a culture of quality know that continuous improvement is everyone’s job. They believe that ideas for positive change can come from any employee and that engagement is an essential part of how individual success is measured. That’s why KaiNexus provides an easy way to visualize each employee’s activity level and task load. Supervisors can ensure that the load is spread wisely and that everyone is participating as expected.
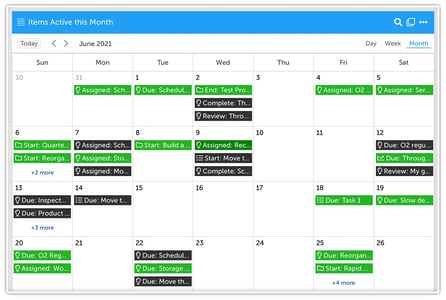
With KaiNexus, users can see upcoming tasks and meetings in calendar format. This makes it easy to avoid conflicts and missed due dates. Users can configure the calendar display to show:
Users can adjust the view to include items by the day, week, or month and they can click on any item to drill down and get more detail.
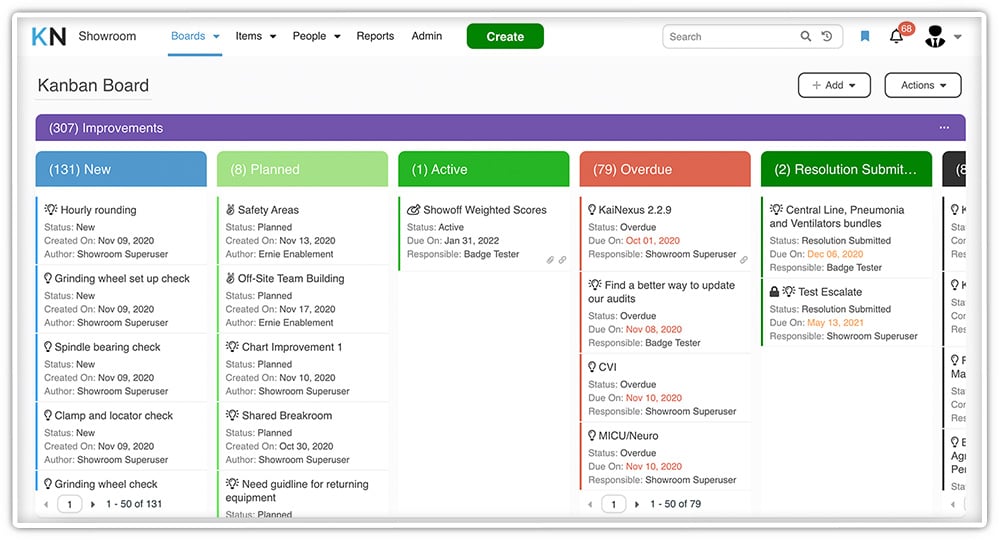
Kanban boards are a visualization tool that helps people understand the flow of their improvement work. The KaiNexus Kanban View lets you quickly check on your work's progress. The Kanban board shows a list of items by status - each column contains all the relevant items of a particular status. For example, columns might be titled “Planned,” “In Progress,” “Overdue,” and “Complete.
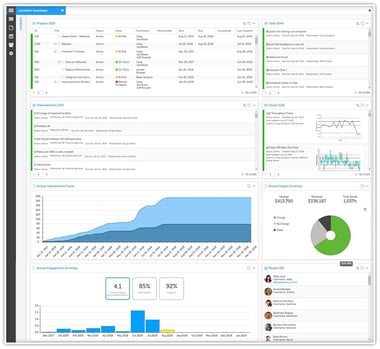
KaiNexus offers configurable dashboards that display tasks and activities related to any given “team.” A team may consist of people who are in the same department who regularly work together and are managed by the same person, or a team may be made up of a cross-functional group that is working on a particular project or group of initiatives. Either way, each member has a simple way to keep track of the progress of each element of the improvement.
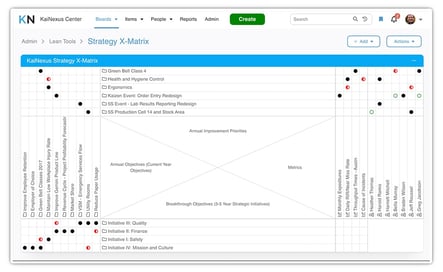
Many organizations use a formal strategy deployment approach called an "X-Matrix" to develop and help implement tactical and strategic plans to coordinate across people throughout the organization. KaiNexus X-matrices help ensure ownership and accountability at every level of the organization while allowing for faster course corrections when needed.

The practice of daily huddle meetings is widespread among organizations dedicated to continuous improvement. In the past, teams would gather around a wallboard or poster to discuss newly proposed, active, and recently completed projects. Conducting daily huddles with KaiNexus visual management software makes it possible to include people who are not present in the workspace in these meetings and increase their effectiveness by allowing users to see the board and drill down into any element for more context. KaiNexus huddle boards can be accessed on mobile devices or PCs and can also be displayed on large monitors in the form of a wallboard.
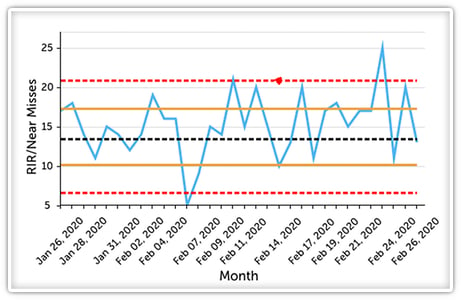
A process control chart allows users to track how a process performs over time. The graph displays data plotted in time order. It has a central line for the average (or the median), a line representing the upper control limit, and a line representing the lower control limit, which is calculated from historical data.
KaiNexus control charts help leaders know when to react to variation and when those variations are within the normal expectations of the process. When a concerning deviation occurs, or the trend starts to shift in unexpected ways, managers can react without delay. Control charts are also helpful in determining whether implemented improvements are getting the expected results.
Organizations of all sizes in all industries in every stage of the improvement journey use KaiNexus. They recognize that continuous improvement is vital to the success of their organizations and that, like with all other complex business processes, they need a visual platform from which to manage it. KaiNexus helps engage the entire organization in improvement and performance excellence. Our customers strive to develop the processes and leadership behaviors critical to sustaining an improvement culture.
If you are ready to reach a new level of visibility and real-time management, KaiNexus is prepared to help.
Copyright © 2026
Privacy Policy