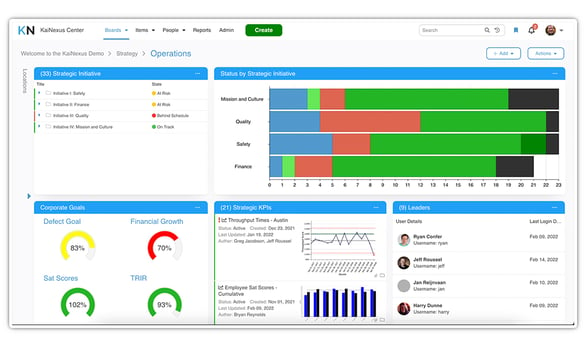
Get real-time impact data at your fingertips by logging the impact of each improvement.
Alert the people who need to verify the accuracy of your results.
See and show exactly what's driving your impact by drilling down into any level.
Update your charts in one place and know that they've updated automatically everywhere else. Ensure that everyone from frontline staff to executives has the most up-to-date information across every board, on every screen, in every location.
Draw parallels between improvements and KPIs by giving context to your data points using linked items and notes in chart annotations.
Know who is submitting lots of improvements, pinpoint which managers may be overloaded, and identify who needs additional coaching. Set activity goals and track progress toward them to improve long-term vision and short-term motivation.

Don't make key stakeholders wait for the next meeting to know your impact. Increase engagement and interest in improvement by giving everyone access to impact data, any time.
Copyright © 2026
Privacy Policy