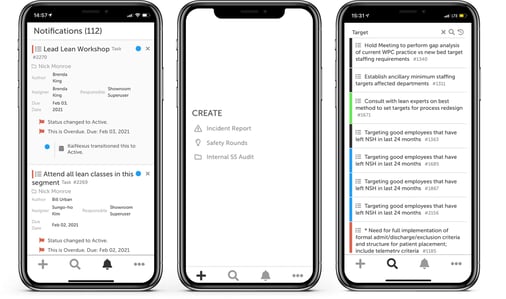
When presented with information visually, people are significantly more likely to process and remember it than if the information is presented in other ways. Smart organizations are starting to take note of this phenomenon and make a concentrated effort to present as much information visually as possible.
Visual management is often used to make it easier to identify problems and bottlenecks in a workflow or process. For example, in many car factories, there are lines painted on the assembly line that let everyone gauge the timing of the process. If the work in a station has taken longer than normal, the car will cross the line, signaling that there’s a problem in the system (keeping with the Lean principle that we don’t look first to blame individuals). Also in car factories, a worker might pull the “andon cord,” which will trigger some kind of visual display on a digital board (along with auditory chimes) to help leaders know that there’s a problem.
Visual management is a powerful tool for continuous improvement. It makes it easier to engage staff, gives leaders insight into key information, and helps to ensure improvements are moving along as planned.
Many people use paper or offline systems, such as Excel, for visual management around continuous improvement. Limitations of this process are numerous, however, and an increasing number of organizations are finding that continuous improvement software helps them to better achieve the benefits they seek from visual management.
The whole point of visual management in an improvement culture is that it needs to be easy to spot where problems are so that you can be certain you’re not missing anything. That lets you devote your energy to fixing problems, rather than locating them. Continuous improvement software raises the red flags you need to instantly locate problems from anywhere.
Effective visual management tools provide updates in real-time so that there is no delay between when the problem is identified by one person and when the appropriate people are notified. You want to be able to respond to the problem as quickly as possible.
Using software that automatically updates boards to track workflows, bottlenecks, and stagnant projects helps you catch small problems on the spot before they become bigger ones. The software automatically updates everywhere at once, while static paper boards and excel sheets cannot. This means that whatever your people are looking at, and wherever it’s located, you’ll know that it’s always up to date.

When your boards are digital, leaders are able to keep tabs on them without having to walk or drive to each location. That means that they constantly have a finger on the pulse of improvement throughout the organization. Of course, no software tool should attempt to replace all face-to-face communication. Instead, these boards should replace or supplement your paper boards, giving you the benefits of visual management on the floor with increased visibility off-location.
It’s hard to keep people engaged with old-fashioned bulletin boards because people are only actively engaged when standing in front of the board. With digital boards, everyone stays involved and up-to-date with the board at all times. From the perspective of managers, detailed reports make it easy to hone in on which areas are performing well and which need help so that your coaching has the maximum impact. Employees can use improvement software to visualize the impact their improvements have on the organization, thus increasing their drive to participate more in the future.

Leading organizations today know that a culture of continuous improvement is key to remaining competitive and innovative. Visual management helps to reinforce this culture by bringing continuous improvement to the forefront of everyone’s minds, all the time.
In order to be most effective, your visual management tools should be easily accessible by staff members and large enough to be easy to read. They should not be located in places that are “out of the way.” If they are far away from staff members’ usual work areas they will not be seen or used because of the extra time it takes to access it, which defeats the purpose entirely.
Additionally, if your visual management tools are complex and difficult to understand, they will not get used. Making tools as simple as possible will increase their usability and make staff members more likely to use them. Visual management tools that sit unused can actually increase the problems in an organization because managers may believe that, since they do not see any problems, there are no problems.
A Huddle is a daily small group discussion, usually meeting in front of a Huddle Board. These boards provide a place to provide feedback to teams, list problems, and promote collaboration.
They have team metrics, graphs, charts, and visualized ideas. Giving visual cues to teams can help spur ideas and promote creativity.
Making these boards digital makes it possible to stay in the loop between huddles and spend the meeting time engaged in strategic planning rather than status updates.
Kanban is a visual management tool that highlights workflows using visual indicators. Kanban in Japanese translates to “signboard” or “visual signage.” This workflow can be improvement work, patients moving through a hospital, or manufacturing steps in a conveyor belt. The goal is to be able to move work through a cycle without delay or lag, focusing on interruptions to the flow.
Making your kanban boards digital means that no one is wasting time updating the boards; improvements and projects automatically flow through the chart based on their current status.
A Gemba Walk may not at first strike you as an example of visual management, but walking around and seeing frontline work environments is definitely a form of visual management. Gemba Walks is a type of management that involves visiting employees first hand to review processes, gather data, see the challenges that front-line employees face on a daily basis.
Organizing the data from your Gemba walks in continuous improvement software makes it possible to track the resulting improvements, monitor KPIs, and ensure nothing falls through the cracks.
It's common knowledge that in order to achieve a significant milestone, you need to set a goal and stick with it. It's less well-known, though no less important, to make sure that the goal is shared publically and often.
This is where visual management comes into play. Displaying your KPIs on a chart that updates in real-time alongside the goals you've set for the organization keeps everyone engaged and on track.
When your job is to make sure that improvement is spreading in the organization and help people stay on track with their projects, you need software that increases visibility into the improvement process.
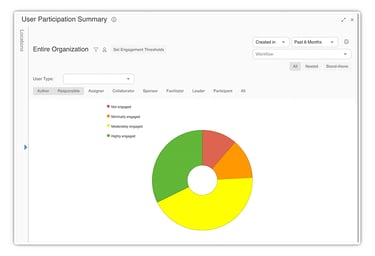
Visual management in the form of user and location activity summaries, clearly displaying progress and results, makes it easy for leaders to supervise and support a much larger team than otherwise would be possible.
Copyright © 2026
Privacy Policy