The most successful businesses are not perfect. They are resilient. Every business encounters problems; most encounter them frequently. The ones that thrive are developing a problem-solving culture and arm employees with the tools to find and resolve the root causes of issues effectively. When employees are effective, empowered problem-solvers, obstacles turn into opportunities. One powerful problem-solving tool is the Fishbone Diagram.

A Fishbone Diagram also called an Ishikawa diagram or cause and effect diagram is a visual management tool used to document all the potential causes of a problem to uncover the root causes. The Fishbone Diagram helps users group these causes into categories and provides a structure to display them. When used effectively, it ensures that teams address the actual cause of the problem and don’t just implement a Band-aid solution.
The Fishbone Diagram is called such due to its resemblance to a fish’s skeleton. It was developed by Kaoru Ishikawa and became popular in the 1960s. It is used within many modern quality management methodologies, including Six Sigma and Lean Manufacturing.
Although we refer to the Fishbone Diagram as a structured problem-solving tool, it has other uses. It is helpful in breaking down the contributors to any process or system. Some ways to use it to test a problem statement, conduct root cause analysis, predict the results of a new process, streamline an existing process, improve quality outcomes, and uncover bottlenecks.

The first step in problem-solving, whether you use the Fishbone or not, is defining the problem correctly. Ideally, the problem statement will include an objective metric that can be used to determine success. For example, a problem statement such as, “The contact center abandon rate is too high,” will not be as helpful as a statement like, “The contact center abandon rate increased by 20% last month.”
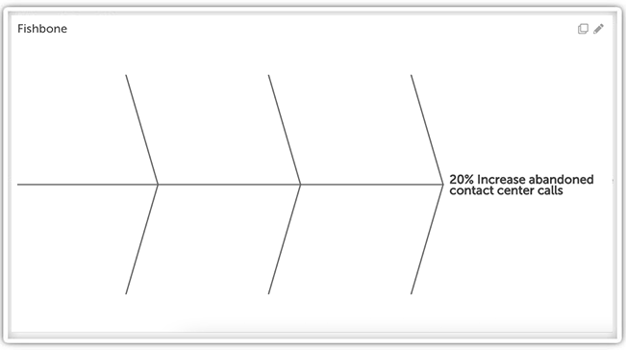
In terms of the Diagram, the problem statement represents the “head” of the fish.
Keep in mind:
The Fishbone tool forces you to think about the potential causes for the problem in several categories represented by the bones. The number will depend on the type and complexity of the problem.
You can choose categories that make sense for your project, but in manufacturing, the 6 Ms are often used. They include:
Another commonly used structure is the McKinsey 7S Framework, which includes Strategy, Structure, Systems, Shared Values, Skills, Style, and Staff. Marketers may go with the 4Ps of Marketing; Product, Place, Price, and Promotion.
Non-manufacturing process may include additional categories such as:
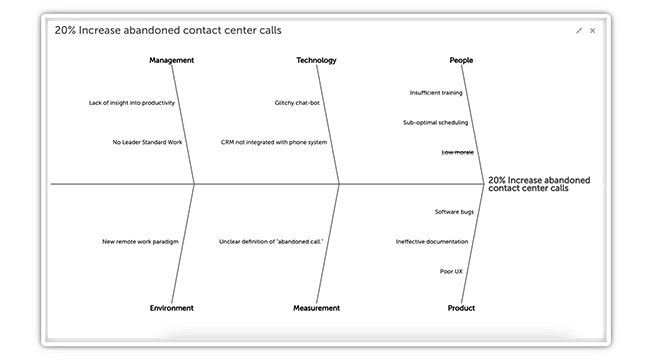
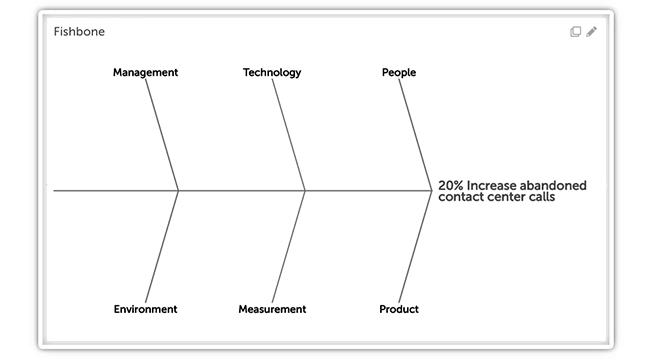
In our software call center abandon rate example, we’ll choose the categories of :

Now that the categories are defined, the team can go through each one and try to determine all the individual influences that can affect our results. Look at each type and list everything that falls within it.
If a potential cause sounds more like a symptom than the root of the matter, the 5 Whys technique can be used to ensure that bottom-line reasons are included. If a source cause supersedes a potential cause, it can be removed from the diagram, or you can use strikethrough to preserve it while moving on to the fundamental problem.
In this example, I’ve struck through “Low morale” as a potential cause because it is most likely a symptom of the lack of training and scheduling problems.
The Fishbone Diagram does not direct you to the solution, but it gives you an idea about where to look. By identifying potential causes in this manner, the team can assess the impact of each and brainstorm possible solutions.
As in the case of our example, you’ll probably find more opportunities for improvement than you can tackle at once, but the exercise will put the team in a better position to decide what to do next. The Fishbone Diagram also becomes a good starting point for the next improvement cycle once your most critical root causes are addressed.
Back in the 1960s when the Fishbone Diagram was introduced, teams used paper to visualize their problem statement and possible causes. While that approach is acceptable for small groups working in the same space for a short period, it is not ideal for the way people work today.
That’s why KaiNexus has incorporated Fishbone Diagrams into our continuous improvement software platform.
Using digital Fishbone Diagrams that are integrated with your improvement management software will help your team solve problems faster and accelerate the pace of positive change.
The Fishbone diagram approach is not complicated, but you can do a few things to get the most out of it. We recommend:
KaiNexus is delighted to put one more digital improvement tool in the hands of our customers. If you’d like to know more about the impact of KaiNexus, one of our experts is available to help.

Copyright © 2025
Privacy Policy