Strategy deployment is perhaps the most crucial responsibility of business executives. Setting the direction for the organization and making the daily decisions that drive the organization closer to “True North” is the essence of leadership. But it’s not easy. Many other concerns compete for resources and attention. It is easy to lose sight of long-term goals in the face of day-to-day activities.
Hoshin Kanri planning is a popular solution for the challenge. It is a technique for bridging the gap between strategy and execution. By laying out the organization’s strategic objectives and cascading goals down to each individual, the organization has aligned priorities, and everyone rows in the same direction. Everyday process improvement is coordinated with the strategy, and decision making is streamlined.
A common way to visualize Hoshin Kanri is the X-matrix. KaiNexus makes it easy to create, manage and share this visual approach to strategy deployment.
An X-Matrix is a chart made up of five sections that visualize your objectives, measures and targets, KPIs, and action items. The format creates an easy way to understand the relationships between short and long-term goals, as well as to define ownership and foster cross-functional collaboration.
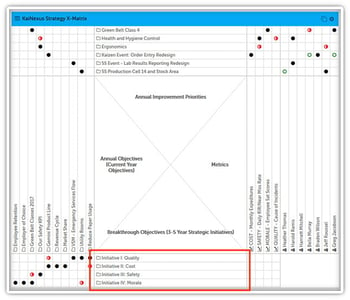
This section contains the key strategic goals to be achieved within the next three to five years. There are only a few of these objectives, but they are central to the organization’s future.
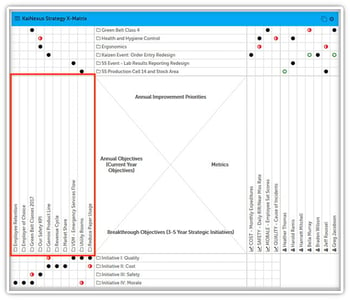
Annual objectives are the shorter-term goals that are necessary to reach the breakthrough objectives. The design of the matrix lets users connect each annual goal to the breakthrough objective that it supports.
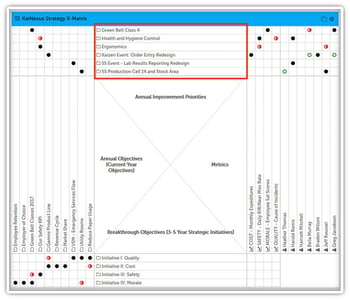
In this area of the matrix-specific opportunities for improvement are defined. These opportunities align with a yearly objective. This is one more step in cascading the breakthrough objectives down into immediately actionable items.
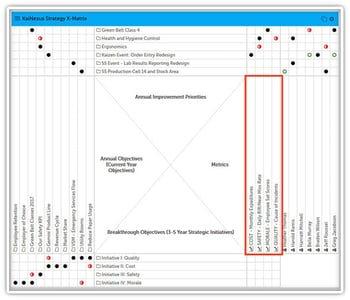
Once leaders have identified the goals and opportunities for improvement, they can decide how success will be defined. The key performance indicators that give everyone insight into progress toward goals are listed in the right quadrant.
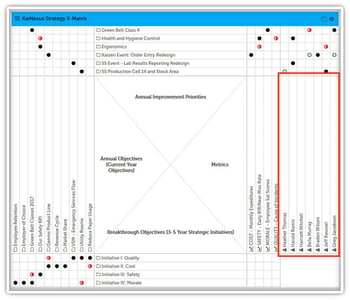
Accountability and ownership are essential components of strategy deployment. The far-right side of the X-matrix is used to assign an owner to each metric, improvement project, and objective.
Although the design of an X-matrix is relatively straightforward, this visual approach to strategy deployment is powerful. The X-matrix has several advantages over less structured strategy deployment:
The process of creating the X-matrix can be used to craft the strategy itself. Most leaders know what the breakthrough goals must be, but the process of filling in the other sections of the matrix can be very revealing. A well-designed X-matrix requires the involvement of multiple stakeholders, providing an opportunity for many voices to help determine how the organization will navigate toward True North.
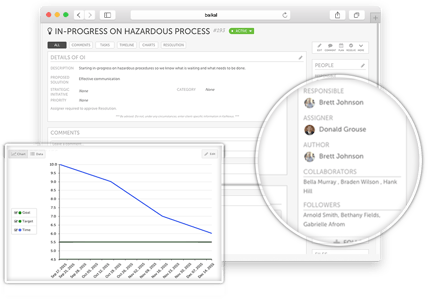

It is challenging to create an emotional connection with a goal that seems impossible or too far in the future. The Hoshin Kanri approach, supported by X-matrix visualization, helps break down breakthrough objectives into manageable goals that people can get to work on right away. The measurement quadrant gives people a way to see how incremental improvements create value by addressing both short and long-term needs.
Cross-functional collaboration is a challenge for most organizations, but it is necessary to solve the most challenging problems and eliminate barriers to success. By creating the X-matrix collaboratively and giving all teams the same view of success, leaders help improve communication and get every person, group, and function working toward the same ends.

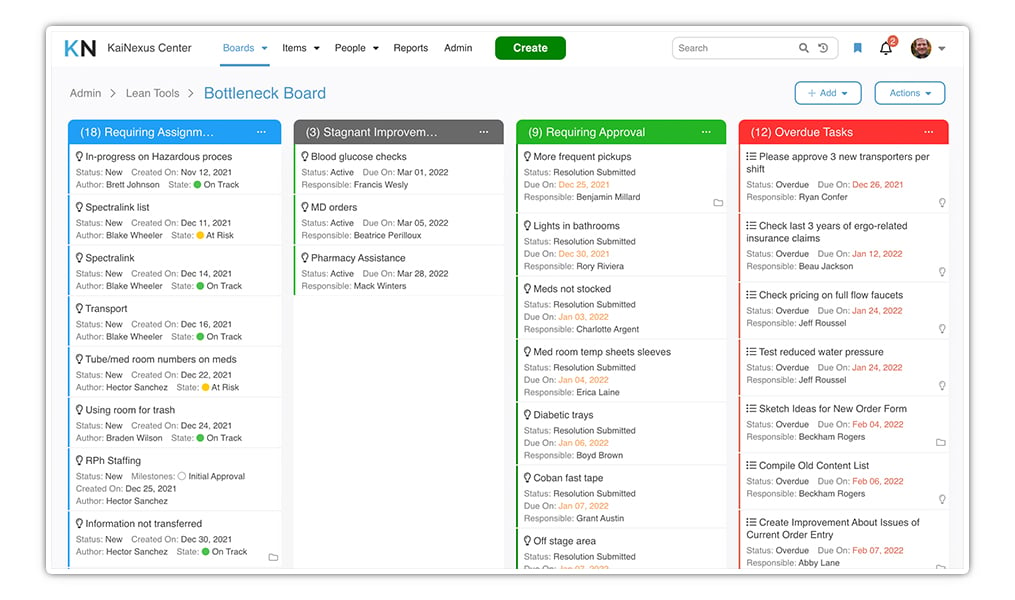
If progress isn’t consistent, the breakthrough goals become impossible to achieve. When operating based on an X-matrix, leaders have the insight necessary to recognize when forward progress has stalled. They can act quickly to remove roadblocks and restore momentum.
One of the biggest challenges in business is deciding how to use the available resources most efficiently. An X-matrix sets the table for decision-making. Activities that align with any section of the matrix should be considered a higher priority than those that don’t. When questions arise about resource allocation, the X-matrix holds the answers.
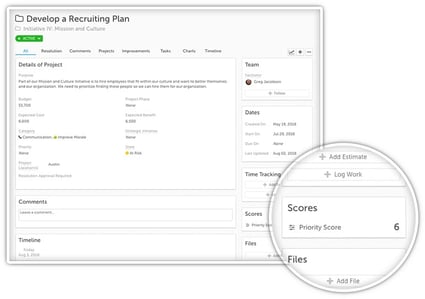
Just as it does for many other management techniques, KaiNexus makes setting up your X-matrix simple. With the KaiNexus X-matrix module, you can deploy this visualization right alongside your other continuous improvement tools. Strategy deployment and daily improvement come together in one robust yet easy-to-use platform.
With the KaiNexus X-Matrix module, you can:
Use permissions to control who has access to create and maintain X-matrices.
Define and manage the Attribute Types used to signify relationships on your X-matrices.
Deploy custom configuration and add X-matrices to your visual management boards.
When deployed in KaiNexus, your X-matrices are to everyone who needs them, keeping the strategic vision top of mind. Users can quickly drill down into the details of any improvement project or goal right from the matrix itself. The results of improvement projects are calculated in KaiNexus, making measuring the metrics seamless.
The KaiNexus X-matrix is the surest path to organizational alignment. Each player will understand how their goals are related to the team’s strategic vision. Activities are aligned because each improvement project and annual objective is connected to one of the breakthrough objectives. Strategy deployment is essential. KaiNexus makes it manageable.
Copyright © 2025
Privacy Policy